Statistics & activity
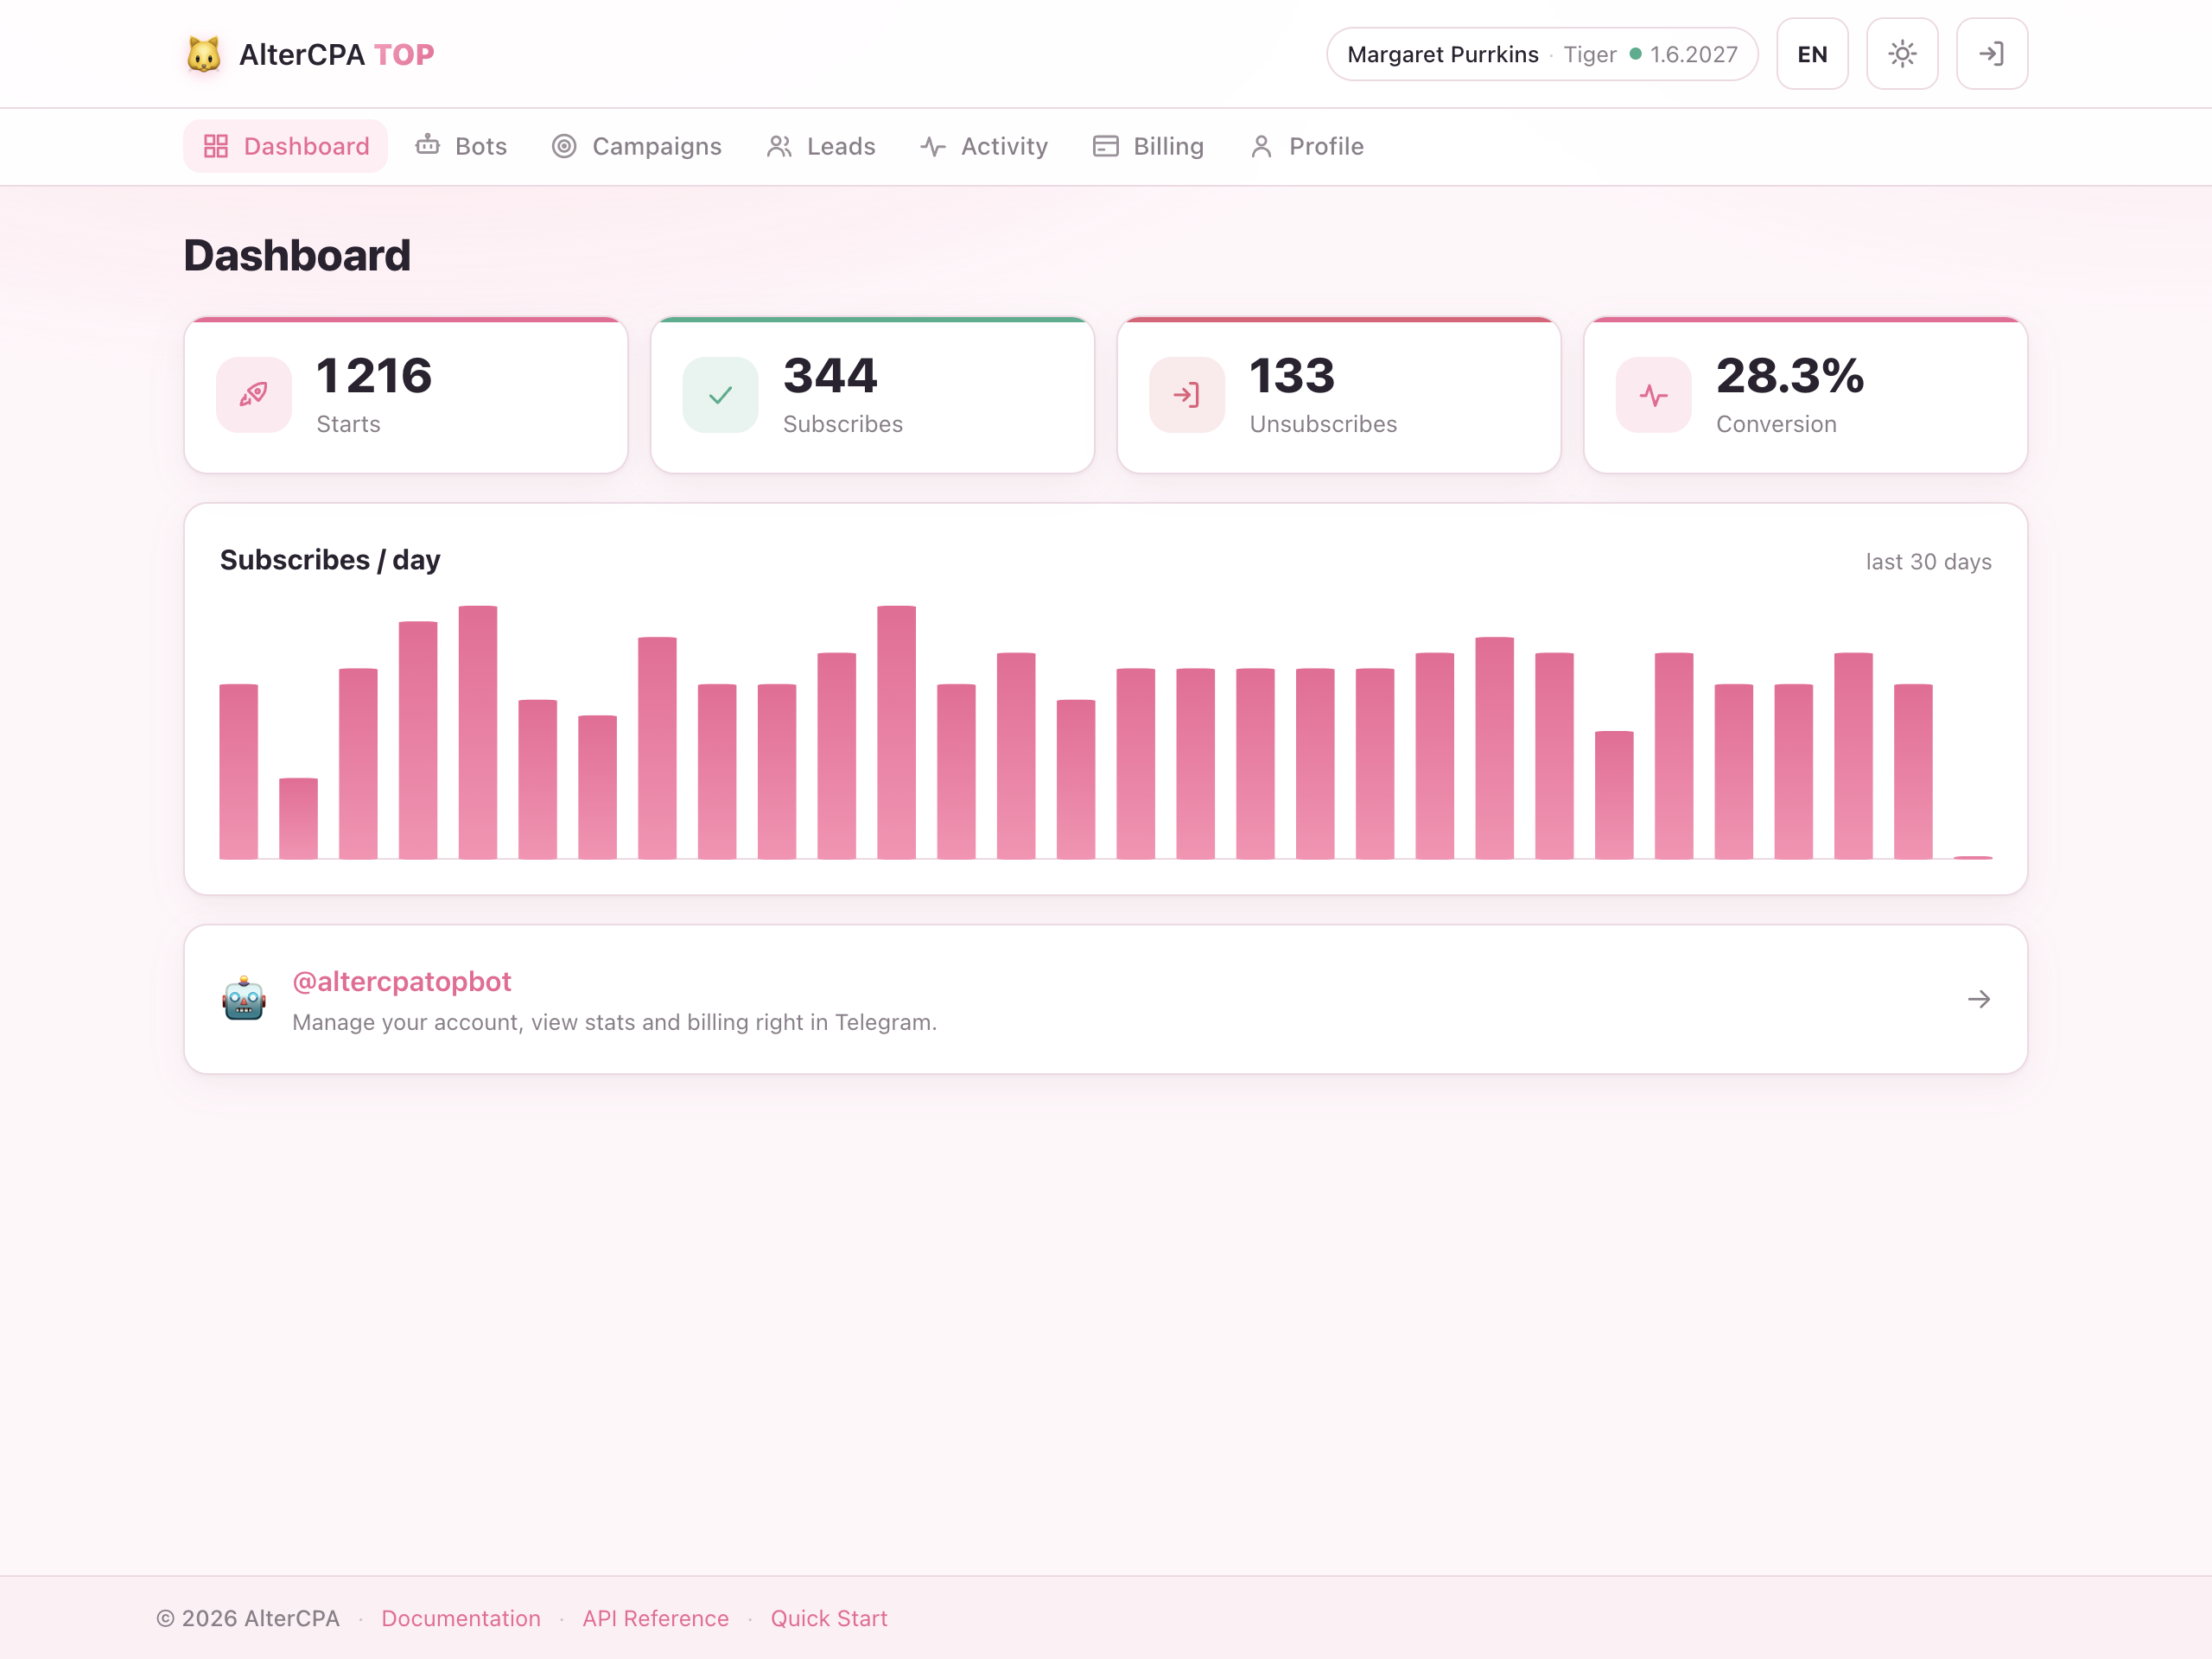
The Statistics section has two tabs:
- Statistics — a grouped summary table of your conversions, broken down by date, campaign, or bot.
- Activity — the raw join/leave journal for your tracked chats, including traffic that came in organically.
The headline KPI tiles and the conversion funnel live on the Dashboard home screen. This page is the detailed, exportable breakdown.
Statistics tab
Open Statistics from the main menu.
Filters
| Control | What it does |
|---|---|
| Group by | Date, Campaign, or Bot — one row per value of the chosen dimension. |
| Bots | Limit the table to one or more bots. |
| Campaigns | Limit the table to one or more campaigns. |
| Activity | All traffic, Organic, or Campaign — scopes only the three activity columns (joins/leaves/bans); the lead-status counts are always campaign-attributed. |
| Date range | The period the report covers (defaults to the last 30 days). |
Columns
The columns are grouped under four headers:
| Group | Columns | Meaning |
|---|---|---|
| Leads | All · Valid | All = every lead created in the period (each /start makes one). Valid = all leads except those that ended in a ban. |
| Statuses | Start · Request · Approve · Cancel · Trash | Your leads counted by their current status — see Leads. |
| Metrics | CR · Validity | CR (conversion rate) = Approve ÷ All. Validity = Valid ÷ All — the share of leads that weren’t banned. |
| Activity | Joins · Leaves · Bans | Physical join/leave/kick events from the journal, scoped by the Activity traffic toggle. |
A Total row at the bottom sums every column across the whole table.
Numbers are computed live from your data (with light caching), so today’s row keeps updating as conversions arrive.
Export — the Export CSV button downloads exactly the rows you’re looking at, with all columns.
Per-campaign shortcut
Each campaign card has a Statistics action that opens this tab pre-filtered to that one campaign — handy for drilling into a single campaign’s numbers without setting the filters by hand.
Activity tab
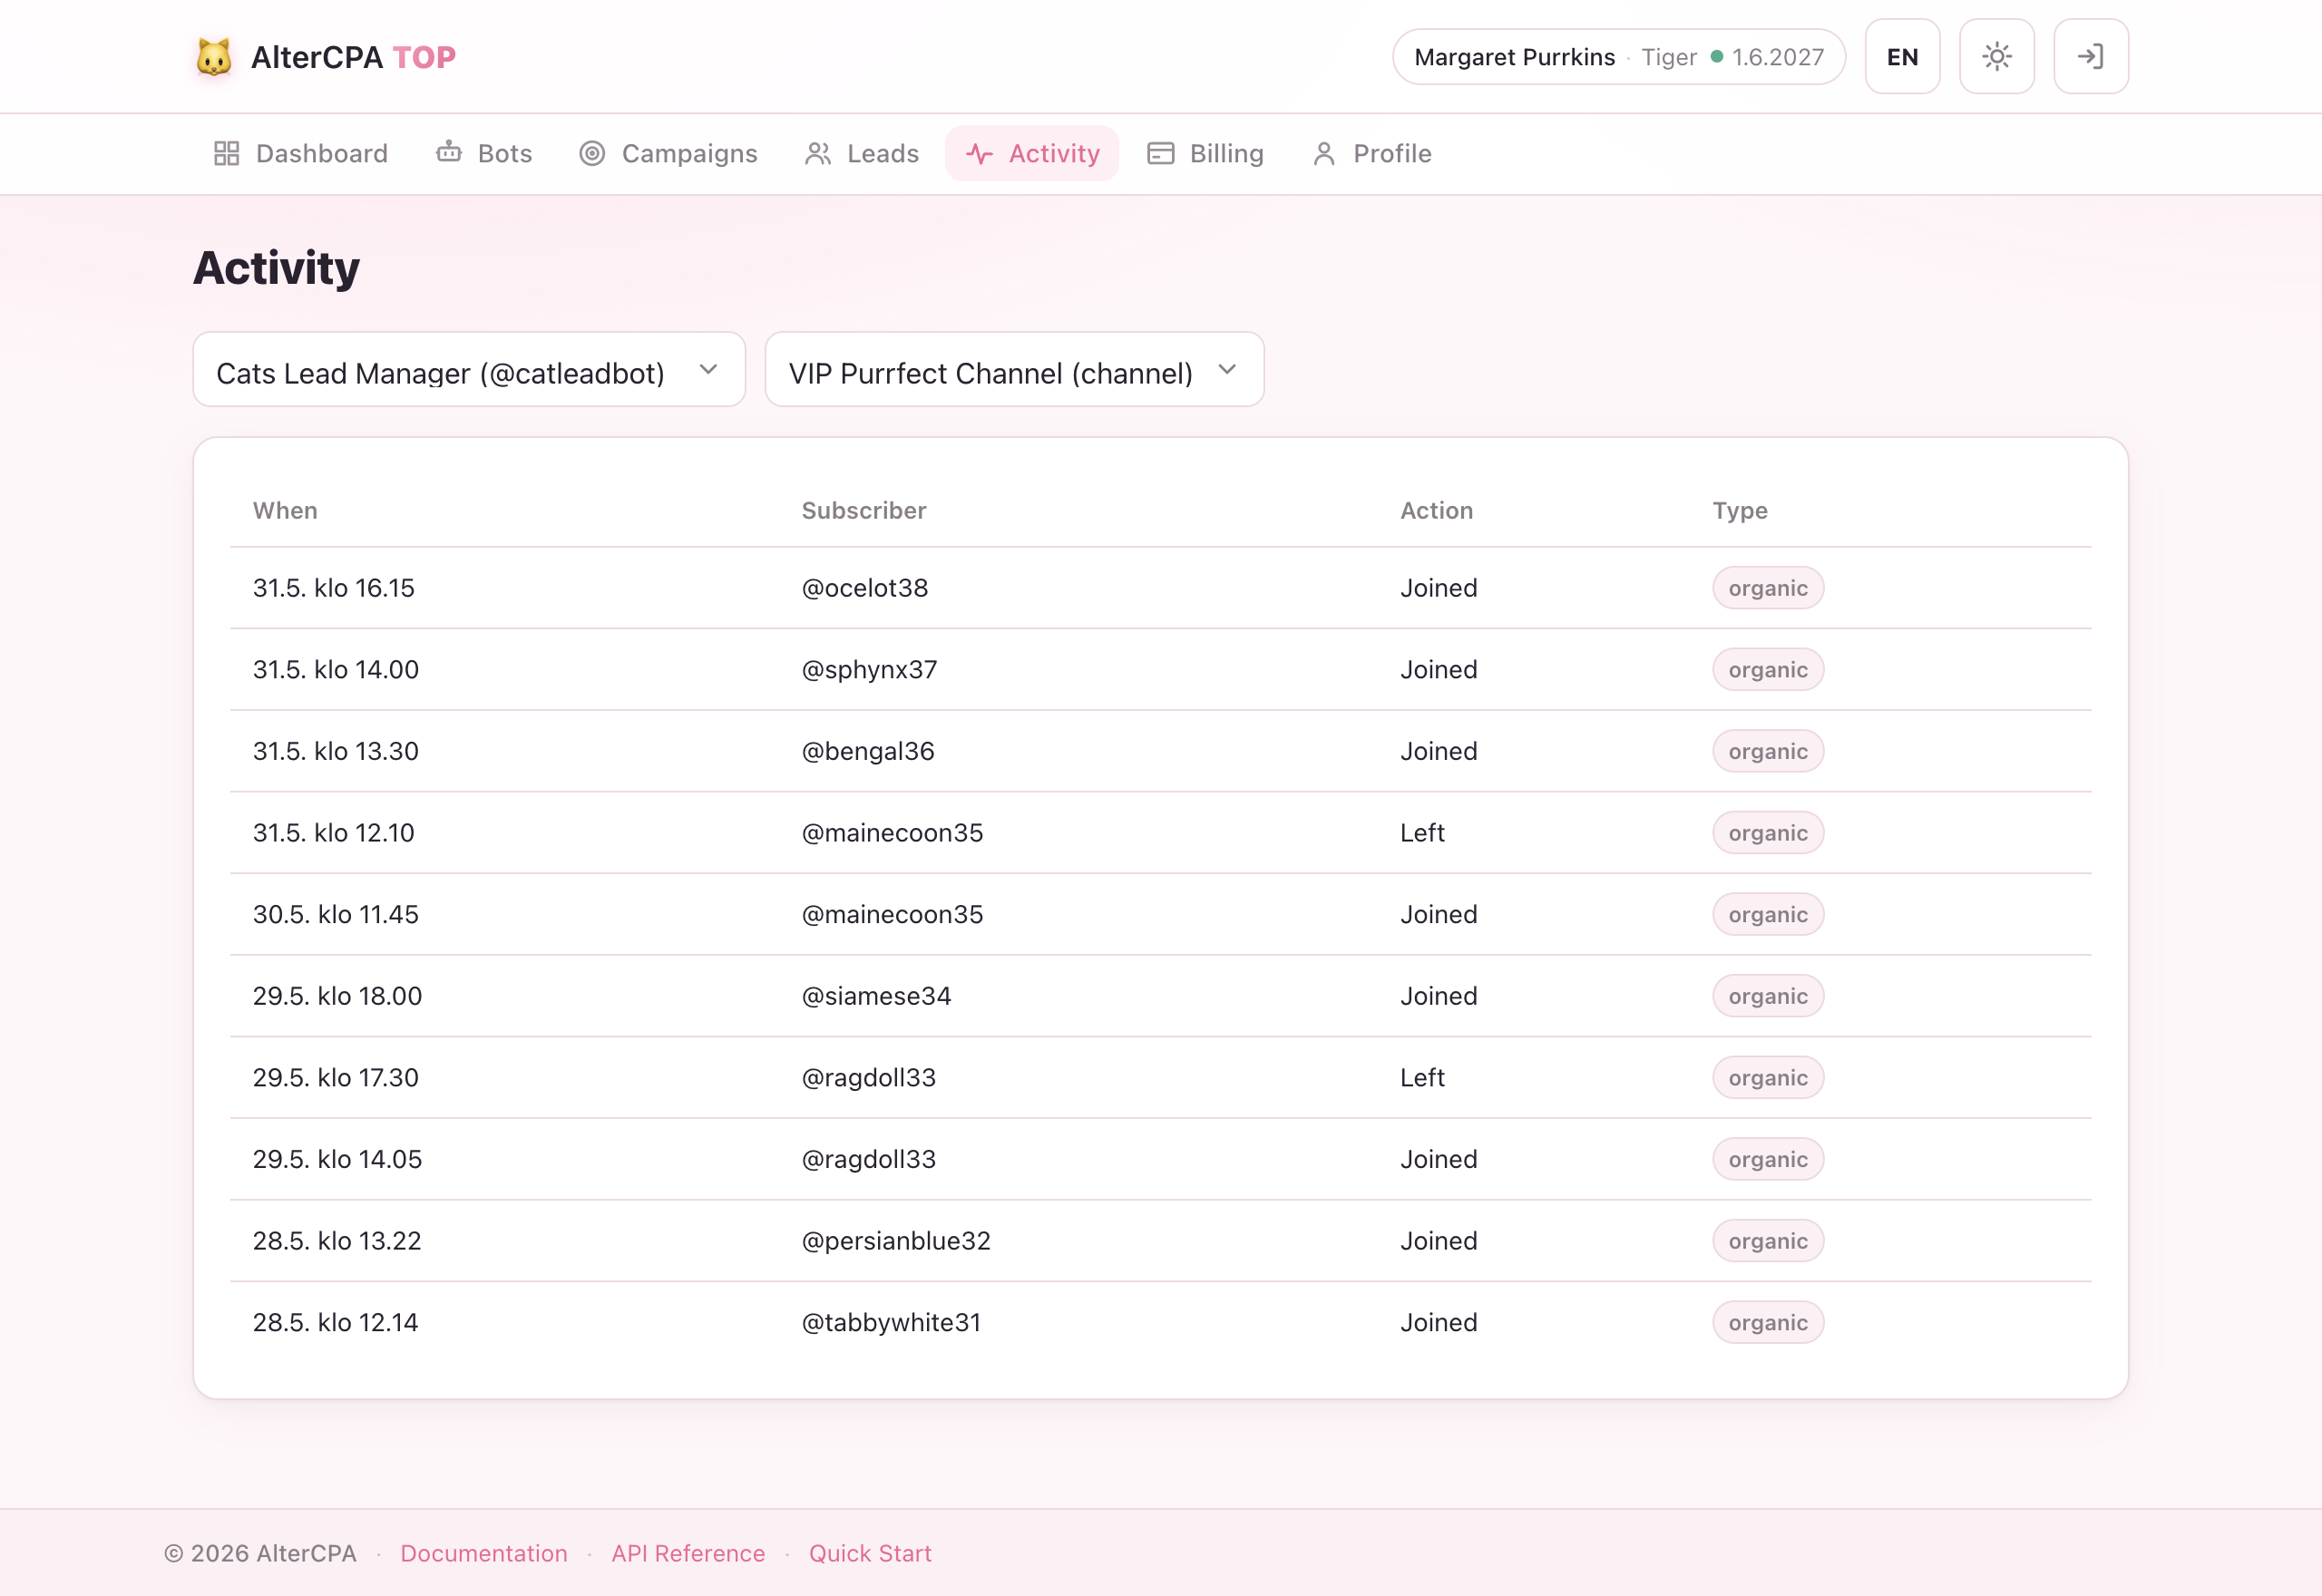
Unlike the Leads table, the journal records every join and leave in your tracked chats — whether or not the person started the bot. This gives you the true dynamics of your channel:
| Column | Content |
|---|---|
| Chat | The tracked channel or group |
| Telegram user | User id and @username |
| Event | Joined, Left, Kicked, or Requested |
| Type | Paid (came through a campaign) or Organic (no bot start) |
| Time | Exact timestamp |
The Activity tab has its own Export CSV button, and a per-campaign Activity shortcut on each campaign card (the same way Statistics does).
Why journal ≠ leads: Leads are attribution records — one per subscriber × campaign, created only when the subscriber starts the bot. The journal is a raw event log — one row per physical join or leave, regardless of attribution. An organic subscriber appears in the journal but not in Leads. A subscriber who starts the bot but never joins appears in Leads (status: Start) but not in the journal until they actually join.
Use the Statistics tab for your campaign performance numbers; use the Activity tab to understand your channel’s overall growth and the paid-vs-organic split.